
The Analytics Playbook: How to Measure, Interpret, and Report SEO Performance
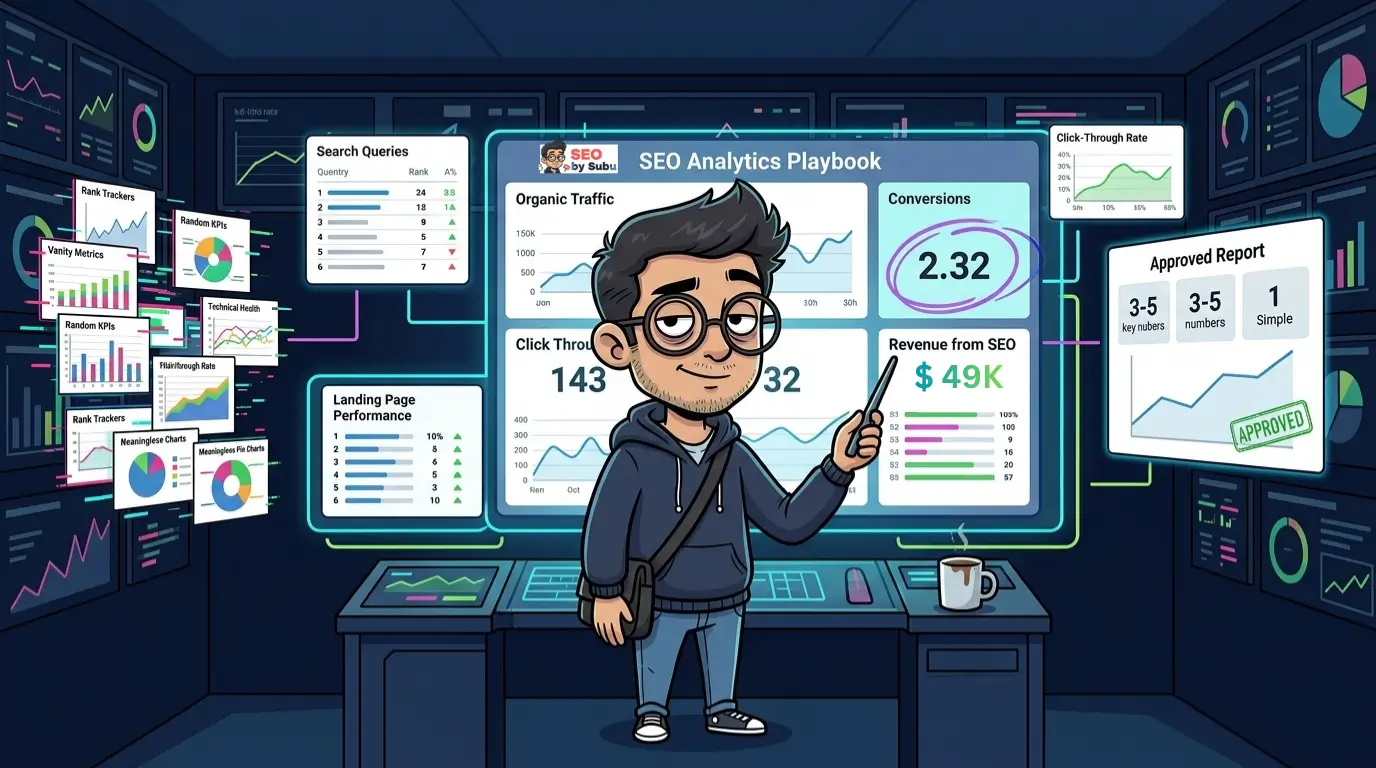
I have sat in too many meetings watching marketers celebrate a 20 percent increase in organic traffic while the company’s revenue was completely flat.
Let me save you years of frustration. Traffic is a vanity metric. Revenue is the only reality. If you are reporting on impressions and pageviews without tying them back to qualified leads or sales, you are not doing SEO analytics. You are doing performance theatre.
Most website owners are flying completely blind. They look at GA4, see a dip in a line graph, and immediately panic assuming an algorithm update just destroyed their business. In reality, a developer probably accidentally deleted the tracking code during a Tuesday deployment. Nobody checked. The reporting dashboard stayed red for three weeks before anyone thought to look at whether the data itself was broken.
This is the fundamental problem with how most organisations approach SEO analytics: they trust the numbers without understanding where the numbers come from, what they are actually measuring, or when they are simply wrong.
The landscape has also gotten structurally harder. Privacy browsers and cookie blockers are stripping analytics data at scale. AI engines are absorbing top-of-funnel clicks before users ever reach your site. Attribution models are fractured across five different touch points that none of your tools agree on. The 2026 measurement environment is genuinely more complex than it was three years ago and the response cannot be to look at fewer metrics. It has to be to understand the remaining metrics better.
This playbook is your analytical baseline. Twelve cluster articles covering every tool, every formula, and every diagnostic process you need to track real business value, survive a catastrophic traffic drop, and build reporting that makes executives care about what you are doing.

Stop obsessing over daily ranking fluctuations. Start tracking Money Actions. Learn to prove your ROI before your budget gets cut.
What’s In This Guide
1. Google Search Console: The Complete Guide
GSC is non-negotiable. It is the only data source that tells you what is actually happening in Google’s index, because the data comes directly from Google. If you are not checking it weekly, you are guessing.
And in a measurement environment where every other tool is approximating, sampled, or privacy-blocked in some way, the one source of ground truth deserves your full attention.
What GSC actually measures and why it is irreplaceable.
Google Search Console captures data that no third-party tool can replicate: the exact queries driving impressions and clicks on your pages, your average position in Google’s results for those queries, the pages Google has crawled and indexed, the errors Google encountered when attempting to crawl, and the manual actions applied against your domain if any exist.
Every other analytics platform is inferring. GSC is reporting what Google directly observed. That distinction matters enormously when diagnosing problems or evaluating performance, because it removes the entire inference layer between you and the source.
The AI-powered configuration update you should be using.
In December 2025, Google introduced AI-powered configuration inside the Search Results Performance report, and rolled it out to all users in February 2026. Instead of manually clicking through filter dropdowns, you describe the analysis you want in plain language.
“Show me the average CTR and average position of queries from India containing the word ‘audit’ in the last 28 days” and the tool configures the filters automatically.

For anyone who has spent time building complex multi-filter views in GSC manually, this is genuinely useful. Complex filtering that used to take five minutes of clicking now takes one sentence. More importantly, it lowers the barrier to ad-hoc analysis, which means you are more likely to investigate something unexpected when you notice it rather than putting it off because setting up the filters felt like work.
The Performance report: the three numbers that matter most.
The Performance report gives you Impressions, Clicks, Average CTR, and Average Position. These four metrics tell a specific story that you need to read correctly rather than in isolation.
Hover or tap to simulate the zero-click performance trap
Impressions without clicks means your pages are being surfaced but are not compelling enough in the SERP to earn the click. The problem is either a weak title tag, a weak meta description, or a SERP feature like an AI Overview or featured snippet that answers the question without requiring the click.
High CTR on low impressions means you have a compelling page that is underranking. Strong title and meta but insufficient authority or topical depth to push the ranking up. The fix is content depth and link building, not on-page optimisation.
Position improvements without click increases are the 2026 signal worth paying attention to specifically. If your average position on a query moved from 6 to 3 but your clicks stayed flat, an AI Overview is almost certainly appearing above position one and absorbing the clicks that position three used to receive. This is data, not a crisis. It tells you the query has become a zero-click target and your content investment strategy for it needs to shift.
The Indexing report: where most sites have hidden problems.
Open the Indexing report in GSC. Look at every status category carefully.
- “Crawled currently not indexed” is the most underinvestigated status in most GSC accounts. This means Google visited the page and decided not to index it. It is not blocked. It is not erroring. Google just looked at it and decided it was not worth including in the index. Common causes: thin content, near-duplicate of a stronger page, low quality signals across the domain pulling the threshold down. Every page in this status deserves a content quality review.
- “Discovered currently not indexed” means Google knows the page exists but has not crawled it yet. Often a crawl budget or internal linking problem. Pages sitting in this status for more than a few weeks on an established domain are being deprioritised by the crawler. Check internal links to these pages and check whether their template type has known crawl issues.
- “Duplicate submitted URL is not selected as canonical” means you submitted a URL in your sitemap that Google decided is a duplicate and has chosen a different canonical. This is a direct conflict between your sitemap submission and your canonicalisation strategy. Find the discrepancy and resolve it.
2. Google Analytics 4 for SEO
Yes, the GA4 interface is rough. Yes, everyone misses Universal Analytics. No, that nostalgia is not a strategy.
GA4 is what exists, it has been the default since July 2023, and if you have spent the last two years avoiding learning it properly, the gap between what your analytics is telling you and what is actually happening to your organic traffic is growing every month.
The core shift you need to internalize: GA4 moved from a pageview-centric model to an event-based architecture.
Everything is an event. Pageviews are events. Scrolls are events. Clicks are events. Conversions are events.
This sounds abstract until you realise it means you can track and report on almost anything a user does on your site without hacking workarounds into the old model.
Hover or tap to see how GA4 fixes the broken bounce rate metric
Engagement rate over bounce rate.
Stop looking for bounce rate as a primary metric. GA4 replaced it with engagement rate, which is the inverse of bounce rate and a more useful signal anyway.
An engaged session in GA4 is one where the user either stays on the site for longer than 10 seconds, views two or more pages, or triggers a conversion event.
Engagement rate is the percentage of sessions that qualify. A high engagement rate on an organic landing page means users who arrive from search are finding the page relevant enough to interact with meaningfully.
A low engagement rate means they are arriving and immediately leaving which is either a relevance problem (wrong audience) or a content problem (right audience, wrong answer).
The 10-second threshold is adjustable in GA4’s tag settings, which most people do not know. If your content is intentionally short-form and a 10-second session represents a successful read, adjust the threshold down. If your content is long-form and 10 seconds barely covers the introduction, consider whether the default threshold is measuring what you actually care about.
The custom dimensions you need to configure.
Out-of-the-box GA4 gives you a functional but limited picture of your organic traffic.
Custom dimensions unlock the segmentation that makes GA4 actually useful for SEO. The minimum custom dimensions worth configuring:
- Scroll depth. How far down the page users are scrolling before leaving. A page where 80 percent of organic visitors leave before reaching 50 percent scroll depth has an above-the-fold content problem. The page is not immediately delivering what the user came for.
- User status. Logged-in versus guest. For sites with accounts, logged-in organic users have dramatically different behaviour and conversion patterns than anonymous visitors. Mixing them in your organic traffic reports creates a misleadingly blended picture of how SEO-driven visitors actually behave.
- Content type. Blog post versus product page versus category page versus landing page. Traffic behaviour on an informational guide looks completely different from behaviour on a transactional product page. Without content type as a dimension, your organic traffic report is averaging behaviour across pages that have nothing in common.
The BigQuery export: the reporting superpower most people never use.
GA4’s native interface is limited in its reporting flexibility. The BigQuery export is where the serious analysis lives.
By exporting raw GA4 event data into BigQuery and joining it with your CRM data, you can answer questions that GA4’s native reporting cannot touch: what is the lifetime value of customers who first arrived through organic search?
Which specific keyword clusters are driving customers who stay longest and spend most?
What is the average number of organic touchpoints before a lead converts to revenue?
These are the metrics that make an SEO’s business case at board level.
The setup requires a developer for the BigQuery connection and a data analyst for the queries, but for any organisation where SEO represents meaningful revenue, the investment pays back in the first presentation where you can show revenue-per-organic-session by landing page cluster.
→ Full deep-dive in Google Analytics 4 for SEO
3. How to Track Keyword Rankings
Obsessing over daily keyword position changes is the SEO equivalent of checking your stock portfolio every fifteen minutes. It will give you anxiety, it will distort your decisions, and the data you are reacting to will be meaningless noise most of the time.
Rankings fluctuate constantly. Google runs continuous algorithmic tests. Position varies by location, device, search history, and whether Google is in the middle of a data centre refresh.
A ranking moving from position four to position seven on a Tuesday and back to position four by Thursday is not a signal.
It is static. Treating it as a signal is how practitioners burn hours chasing movements that resolve themselves.
Hover or tap to filter out the noise and view the true signal
What to track instead of individual keyword positions.
Track keyword cohorts rather than individual terms. Group your target keywords into meaningful clusters: bottom-of-funnel transactional terms, mid-funnel comparative terms, top-of-funnel informational terms.
Track the average position trend across each cohort over time.
A cohort moving consistently in a direction over four to six weeks is a signal.
An individual keyword jumping around within a range is noise.
This approach also protects you from the single-keyword vanity trap.
A site that ranks position one for one high-volume keyword and position fifteen for everything else in its category is structurally weaker than a site that ranks between four and eight across forty relevant terms.
The first site looks better in a simple ranking report. The second site has significantly more resilient, broad-based organic visibility.
Dynamic CTR modelling: why raw position data misleads in 2026.
A rank-one position in 2026 is not the same thing it was in 2022. When a Google AI Overview appears above position one, the actual click-through rate for the organic result sitting in position one can drop significantly.
A raw ranking report that shows “position one” without accounting for SERP features is telling you about your position but not about the traffic that position is actually delivering.
Modern rank tracking tools offer Dynamic CTR modelling that adjusts estimated traffic based on the actual layout of the SERP for each query, accounting for the presence of AI Overviews, featured snippets, shopping carousels, and knowledge panels above the organic results.
Use this feature. A keyword where you rank position two behind a full AI Overview is a zero-click target regardless of what the position number says. A keyword where you rank position five on a clean SERP with no features may be delivering more clicks than the position suggests.
The Citation Rate metric: what rank tracking cannot measure.
For queries where AI Overviews are now the primary SERP feature, traditional rank tracking misses the most important measurement question entirely: is your brand being cited in the AI response?
Tracking your Citation Rate how often your content appears as a source in AI-generated answers for your target queries sits outside traditional rank tracking toolsets.
It requires the manual AI audit process described in Pillar Nine, or the use of dedicated GEO monitoring tools like Semrush’s AI Toolkit.
But for any content strategy that includes top-of-funnel informational targeting in 2026, Citation Rate is the metric that tells you whether your content is performing in the environment where the traffic actually lives.
→ Full deep-dive in How to Track Keyword Rankings
4. Organic Traffic: How to Read It Correctly
A 40 percent increase in organic traffic with no corresponding change in revenue is not a success story. It is a data quality problem waiting to be diagnosed.
Not all organic traffic is created equal. A surge in traffic to a top-of-funnel blog post that has never generated a single lead is a meaningless number.
Traffic that converts at 0.01 percent is worse than traffic that never arrives, because it distorts your analytics, inflates your session counts, and makes your conversion rate look worse than it actually is on the pages that matter.
Reading organic traffic correctly requires three segmentation steps that most reporting skips entirely.
Hover or tap to separate the funnel stages
Step one: separate branded from non-branded.
Branded organic traffic users who searched your company name or a variation of it and clicked your result is primarily a measure of brand awareness. It tells you that offline marketing, word of mouth, PR, and repeat customers are working.
However, it also captures the delayed ROI of your SEO efforts. A user who finds you through a non-branded discovery search might not be ready to buy today. But that initial SEO touchpoint creates Top of Mind recall. When they are ready to convert two weeks later, they search your brand name. Claiming branded queries are completely unrelated to SEO is ignoring how human memory works.
Non-branded organic traffic measures net new discovery. These are users who found you through a search that did not include your name. Google decided you were the best answer to their question. That metric measures whether your top of funnel SEO investment is capturing fresh audiences.
Because they measure completely different stages of the journey discovery versus recall mixing them without separation means every number in your report is blended and partially misleading.
Filter your traffic in GSC by excluding queries containing your brand name. Use that non-branded segment to track your net new SEO discovery. Use your branded segment to track bottom of funnel intent and recall. They are both vital, but they belong on different charts.
Step two: segment by page type and intent.
A category page on an e-commerce site, a long-form informational guide on a B2B blog, and a transactional landing page for a local service business have completely different traffic behaviour profiles.
An average engagement rate, average session duration, or average conversion rate across all three simultaneously is an average of fundamentally different things.
It tells you almost nothing useful.
Build separate traffic segments for each major page type in your analytics.
Report on each segment against its appropriate success metric. Informational content is measured on engagement rate and scroll depth.
Commercial content is measured on conversion rate and revenue attribution.
Category pages are measured on click-through to product pages and add-to-cart rate.
Each segment needs its own KPIs, not a share of a blended average.
Step three: account for the structural decline in top-of-funnel informational traffic.
This one requires honesty with stakeholders. Top-of-funnel informational organic traffic is declining globally as AI Overviews absorb an increasing proportion of simple query responses.
If your content library is heavily weighted toward definitional and informational content, your overall organic traffic may decline in 2026 and 2027 regardless of whether your SEO is improving or deteriorating.
Distinguishing between traffic that declined because your SEO got worse and traffic that declined because the entire query category moved to zero-click AI responses requires looking at your impressions alongside your clicks.
If impressions are stable or growing while clicks are declining on informational queries, the problem is not your ranking.
It is AI Overviews absorbing the clicks. The response is a content strategy shift, not an SEO technical fix.
Making this distinction clearly in your reporting is what separates an analyst who understands the environment from one who is just reporting numbers.
→ Full deep-dive in Organic Traffic: How to Read It Correctly
5. How to Measure SEO ROI
If you cannot prove your financial value in concrete numbers, you are a cost centre waiting to be cut. This is not cynicism. It is the reality of every marketing budget conversation that happens above your pay grade.
The good news: SEO ROI is measurable. The bad news: most practitioners measure it wrong, which makes their numbers either inflated enough to be dismissed or depressingly low because they are counting the wrong things.
The correct formula.
The standard SEO ROI formula is:
SEO ROI = ((Revenue from SEO – Cost of SEO) / Cost of SEO) × 100
This gives you a percentage. If your SEO investment was ₹2,00,000 over a quarter and the organic conversions attributed to SEO generated ₹8,00,000 in revenue, your ROI is 300 percent.
For every rupee spent, you returned four. That number belongs in a boardroom presentation.
Hover or tap to apply the hidden internal costs to the denominator
What trips most practitioners up is the inputs, not the formula.
Revenue from SEO requires proper conversion tracking in GA4 with monetary values assigned to each conversion type.
Demo request value for B2B. Average order value for e-commerce.
Lead-to-close rate multiplied by average deal size for anything with a sales cycle.
If GA4 is tracking conversions but not their monetary value, the formula has a gap. Fill it.
Cost of SEO includes everything: agency retainer or salary cost, content production, tool subscriptions, link building spend, technical development time charged to SEO work.
Most ROI calculations undercount costs by forgetting the internal time allocation.
A founder spending ten hours per week reviewing SEO deliverables has an opportunity cost that belongs in the denominator.
Before you touch a formula: define your Money Actions.
Money Actions are the specific conversion events that represent real business value.
Define them before any measurement conversation, because if you measure the wrong things, the formula will produce a correct number for the wrong question.
- For B2B: demo request completions, quote form submissions, qualified lead form fills. Not newsletter signups, not PDF downloads, not time-on-page.
- For e-commerce: completed transactions and revenue. Not add-to-cart events, not product page views.
- For local businesses: phone calls, direction requests, booking completions. Not Google Business Profile impressions.
Newsletter signups and PDF downloads are engagement indicators. They are useful context.
They are not Money Actions and they do not belong as primary ROI metrics unless you have data proving a specific conversion path from those micro-conversions to revenue.
The 6 to 12 month reality check.
SEO ROI has a delayed payback curve that paid channels do not.
A Google Ads campaign can generate ROI in week one.
An SEO content campaign typically requires six to twelve months before it breaks even, with peak profitability arriving in year two and year three as content compounds, rankings strengthen, and backlinks accumulate.
This timeline is non-negotiable and it is the single most important expectation to set with any client or stakeholder before a campaign starts.
Present this curve proactively. If a client expects month-two ROI from an SEO retainer, either reset the expectation before starting or decline the engagement, because you will lose that client at month three and they will tell everyone SEO does not work.
The PPC Gap: the quick wins metric for early-stage reporting.
In the months before revenue attribution is meaningful, the PPC Gap provides a legitimate and easily understood proxy for SEO value.
Calculate the total monthly clicks your organic results are generating from GSC.
Then calculate what those same clicks would cost at current average CPC rates in Google Ads for the same keywords.
The gap between zero cost and that hypothetical spend is the media value your SEO is delivering.
A campaign generating 5,000 organic clicks per month on keywords with an average CPC of ₹80 is delivering ₹4,00,000 per month in media value equivalent.
Present this clearly while revenue attribution is still developing. It is not the real ROI number, but it is a legitimate value signal that makes sense to non-technical stakeholders immediately.
→ Full deep-dive in How to Measure SEO ROI
6. Understanding Impressions, Clicks, and CTR
This is the section that prevents a specific client conversation that otherwise happens in every SEO engagement at least once: “Why do your Google Search Console numbers not match your Google Analytics numbers? Which one is lying?”
Neither is lying. They are measuring different things at completely different points in the user journey.
Understanding the gap between them is not a data hygiene problem to solve.
It is a structural difference to explain, once, clearly, so it never becomes a trust issue again.
What each metric actually measures.
An impression in GSC is recorded every time your page appears in a Google search result that a user sees.
The user does not have to click. The page does not have to be above the fold.
It simply has to appear in a result that was served.
A click in GSC is recorded when a user clicks your result and is taken to your page.
This happens entirely on Google’s side before your page loads. GSC knows about it immediately.
A session in GA4 is recorded when your page loads, the GA4 tracking code fires, and the event data is sent to Google’s servers.
This happens on your side, after the click, dependent on the user’s browser, privacy settings, and whether your code loaded correctly.
Hover or tap to trigger the GA4 JavaScript blind spot
CTR connects the two GSC metrics: (Clicks / Impressions) × 100 .
A CTR of 3 percent means three out of every hundred people who saw your result in the SERP clicked it.
Average organic CTR varies dramatically by position: position one historically captures 25 to 30 percent CTR on non AI Overview SERPs.
Position ten captures under 2 percent. Position one behind a full AI Overview may capture significantly less than that.
Why GSC clicks and GA4 sessions will never perfectly match.
The gap has multiple causes, and each one operates independently. They stack.
The bounce back click. A user clicks your result, immediately returns to Google, and clicks again. GSC records two clicks.
GA4 records one session unless the gap between clicks exceeds the session timeout, in which case GA4 may record two.
The default session timeout is 30 minutes. Two clicks within 30 minutes on the same page typically resolve as one session in GA4.
The JavaScript blind spot. This is the dominant cause of the gap in 2026 and it is growing. A user with an ad blocker, a strict privacy browser like Brave, or a denied cookie consent prompt clicks your result in GSC. Your page loads. The GA4 tracking script is blocked by the browser’s privacy controls before it can fire. GSC recorded the click. GA4 recorded nothing.
The scale of this gap varies significantly by audience. Technical audiences, privacy conscious demographics, and users in regions with strong GDPR compliance culture block analytics tracking at rates that can cause 20 to 40 percent under reporting in GA4 relative to GSC.
If your audience skews technical, your GA4 numbers are likely a significant undercount of your actual organic traffic.
Bot and automated traffic. GSC filters out known bots before recording clicks.
GA4 also filters bot traffic but has a slightly different detection methodology.
The filtering discrepancy is small but contributes to the gap.
The practical rule for which tool to trust for what.
Trust GSC for visibility metrics: impressions, CTR, and position. These tell you how Google is presenting your pages and how users are responding to that presentation in the SERP.
Trust GA4 for behaviour metrics: what users did after they arrived, how far they scrolled, what they clicked, whether they converted.
These tell you whether your pages are delivering value to the users who arrive. Never use GA4 traffic numbers to evaluate SERP performance. Never use GSC click numbers to evaluate on site engagement. The tools are complementary, not competing. Each answers a different question.
→ Full deep dive in Understanding Impressions, Clicks, and CTR
7. Diagnosing a Traffic Drop
The phone call that every SEO dreads: “Traffic is down 40 percent. What happened?”
The wrong response is to immediately speculate about algorithm updates.
The right response is to run a structured triage before forming any hypothesis at all.
Guessing the cause of a traffic drop and acting on the guess is how sites end up with compounded problems because the wrong fix was applied to the wrong cause.
Here is the 60 minute triage process. Run it in order. Do not skip steps.
Hover or tap to execute the mandatory sequence
Step 1: Verify the data before diagnosing the traffic.
Before assuming something is wrong with your rankings, confirm that your data is actually showing a real traffic event rather than a measurement failure.
Open GSC Performance report. Check the click trend for the same period.
If GSC clicks are stable but GA4 sessions show a drop, the problem is in your tracking implementation, not your rankings.
Common causes: a developer pushed a code update that broke the GA4 tag, a Content Security Policy change is blocking the analytics script, a cookie consent update is defaulting to deny-all rather than opt-in.
If both GSC clicks and GA4 sessions show the same drop at the same time, you have a real organic traffic event.
Proceed to step two.
Step 2: Check for a manual action penalty.
Open GSC. Go to Security and Manual Actions. If a manual action is present, this is your cause.
Manual actions are explicit notifications from a human Google reviewer that your site has violated Google’s guidelines.
They are rare but unambiguous. The notification tells you what was found and what to fix.
Fix it, request a review, and the penalty can be reversed.
If no manual action exists, proceed to step three.
Step 3: Cross reference the drop date against known algorithm updates.
Go to Google’s Search Status Dashboard. Go to Search Engine Land’s algorithm update timeline.
Find every update that rolled out within two weeks either side of your traffic drop date.
If your drop date aligns with a confirmed Core update rollout, the cause is almost certainly algorithmic reassessment of your content quality.
Core updates take two to four weeks to fully roll out.
Traffic typically stabilises at a new level once the rollout completes.
If traffic stabilises and remains lower after the update completes, the signal is that Google reassessed the quality of your pages relative to competitors and found them wanting.
If no algorithm update aligns with the drop date, proceed to step four.
Step 4: Identify whether pages, queries, or both have dropped.
In GSC Performance, segment the traffic drop by page and by query separately.
If specific pages dropped but query impressions are relatively stable, the problem is page-level: canonical changes, accidental noindex tags, internal linking problems, or content quality issues specific to those pages.
If specific queries dropped but your pages are stable, the problem is query-level: a competitor gained authority on those terms, a SERP feature (AI Overview, featured snippet) now absorbs the clicks, or algorithmic intent reassignment changed what result types Google is serving for those queries.
If both pages and queries dropped simultaneously across the site, the problem is domain-level: a sitewide technical issue, a robots.txt change blocking pages, a sitewide canonical misconfiguration, or an algorithmic penalty applied at domain level rather than page level.
Step 5: Diagnose the 2026 specific cause AI Overview absorption.
This step did not exist in traditional traffic drop diagnosis until recently and it is increasingly the actual explanation for drops that look alarming but are not technical SEO failures.
Check whether the queries that lost clicks still have stable or growing impressions.
If impressions held and clicks dropped, the ranking is intact.
What changed is the SERP layout for those queries almost certainly because Google added an AI Overview that is now answering the question directly, absorbing the clicks that your position used to earn. This is not an SEO problem. It is a structural SERP change. The correct response is not technical fixes. It is evaluating whether those queries are still worth targeting, whether your content can be optimised to be cited within the AI Overview itself, and whether your content investment for that topic cluster should shift toward queries the AI cannot fully satisfy.
Step 6: Check for technical issues on affected pages.
If no algorithmic or structural explanation accounts for the full drop, run a targeted crawl on the affected pages using Screaming Frog.
Check for: accidental noindex tags added by a recent CMS update, canonical tags pointing to incorrect URLs, redirect chains that accumulated during a site restructure, internal links to affected pages that were removed or broken during a navigation update, and page speed regressions that pushed Core Web Vitals below Google’s thresholds.
Each of these is fixable within days. Each has caused significant, unexplained-looking traffic drops at sites that looked externally unchanged.
The combination of a targeted crawl and the GSC Coverage report will surface any of them within one working session.
→ Full deep-dive in Diagnosing a Traffic Drop
8. Core Web Vitals Reporting
Core Web Vitals are the one performance metric category where the conversation needs to stay relentlessly anchored to revenue, not technical specifications.
The moment you walk into a stakeholder meeting and say “our LCP is 3.8 seconds and we need to bring it under 2.5,” you have lost the room.
The conversation that keeps budget allocated to performance work is: “Our pages currently take 3.8 seconds to display the main content on mobile. At that speed, our e-commerce conversion rate is statistically 2.5 times lower than it would be at 1 second load time. We are leaving significant revenue on the table on every mobile session, which is 68 percent of our traffic.”
That is a performance conversation. The first version is a technical specification. Nobody allocates budget to a technical specification.
Hover or tap to translate technical specs into business impact
The three metrics and their thresholds.
- LCP Largest Contentful Paint. Measures how long it takes for the largest visible element on the page to load. The threshold is under 2.5 seconds for a passing score. Over 4 seconds is a failing score. The most common LCP element is the hero image or the above-the-fold heading. A failing LCP almost always traces to an unoptimised hero image, render-blocking resources, or a slow server response time.
- INP Interaction to Next Paint. Replaced FID as the responsiveness metric in March 2024. Measures how quickly the page responds after a user interaction a button click, a form input, a menu tap. The threshold is under 200 milliseconds for a passing score. Over 500 milliseconds is failing. Slow INP is almost always caused by heavy JavaScript blocking the main thread, which directly translates to a delayed “Add to Cart” response, a form that feels broken, or a navigation menu that hangs after a tap.
- CLS Cumulative Layout Shift. Measures how much page elements shift around during loading. The threshold is under 0.1. Over 0.25 is failing. The user experience of a failing CLS score is the page jumping around as it loads images appearing and displacing text, banner ads loading and pushing the content down, fonts swapping and reflowing the layout. This causes accidental clicks, user frustration, and genuine mistrust of the page.
How to report CWV to stakeholders without losing them.
Three rules for CWV reporting to non-technical audiences.
Report field data, not lab data. PageSpeed Insights shows both. Field data is what real Chrome users experienced on your pages over the last 28 days. Lab data is a synthetic test run in controlled conditions. Google uses field data for ranking. Stakeholders should see field data.
Report by template type, not site average. A site average CWV score is a blend of your homepage, your product pages, your blog posts, and your checkout flow. The homepage is typically the most optimised page and skews the average upward. The pages that generate revenue may be failing while the site average passes. Report by template.
Translate each failing metric into a user experience description and then into a revenue impact.
LCP failing “the main product image takes 4.2 seconds to appear on mobile, which is when 62 percent of our organic traffic arrives.”
INP failing “the Add to Cart button takes 680 milliseconds to respond after a tap, which users experience as the button being broken.”
CLS above threshold “the page layout shifts three times during loading, causing accidental taps on the wrong elements.”
These descriptions make the problem real. The technical thresholds do not.
→ Full deep-dive in Core Web Vitals Reporting
9. SEO Reporting for Clients
Most SEO agency reports are a masterclass in saying a lot while communicating nothing. Forty pages. Twelve charts. A graph of crawl errors that went from 47 to 39. All of it delivered in a PDF that gets skimmed for two minutes and archived forever.
These reports are not designed to inform the client. They are designed to make the agency look busy. There is a meaningful difference between those two goals, and clients figure out which one they are receiving faster than most agencies realise.
However, the common advice to “just send a three sentence summary” is equally flawed. Clients paying a five thousand dollar monthly retainer need more than three sentences. They need to justify the spend to their board, and they need to know what you are actually doing.
The solution is not removing information. The solution is structuring the information so the client only engages with the depth they actually need.
- Non-Branded Organic Revenue: The actual money generated.
- Qualified Leads / MQLs: Pipeline value created this month.
- High-Intent Traffic Trend: Are discovery searches growing?
- The “So What?”: Translates the above into clear ROI validation.
- What We Shipped: 3 content pieces published, 12 tech fixes pushed.
- What Is Blocked: “We need dev approval on the canonical tags.”
- What Is Next: Clear roadmap for the upcoming 30 days.
- The “So What?”: Proves the retainer fee is actively buying momentum.
- Looker Studio Dashboard: A link, not a screenshot.
- Keyword Position Tracking: The 90-day cohort movements.
- Crawl Error Logs: The technical maintenance checklist.
- The “So What?”: Provides total transparency without cluttering the presentation.
Hover or tap over each tier to see how the pragmatic report is structured
The Pyramid Reporting Structure.
A pragmatic SEO report operates like a pyramid. The top is tiny, sharp, and focused purely on business outcomes. The middle provides operational visibility. The wide base holds all the raw data, completely separated from the presentation.
The Apex: Business Impact. This is page one. It contains three things: Non-branded organic traffic growth, actual organic conversions (with monetary value if possible), and high-intent keyword cluster movement. If the CEO reads nothing else, this page proves the ROI of the channel.
The Core: Campaign Velocity. This is page two. Executives hate feeling like they are paying a retainer into a black box. This section acts as a changelog. It lists what was physically completed this month, what is currently blocked by the client’s internal team, and exactly what is happening next month. It shifts the conversation from “what are you doing” to “how can we help you move faster”.
The Base: The Appendix. Never paste twenty screenshots of a dashboard into a PDF. Include a single link to a live, automated Looker Studio dashboard. If the Marketing Director wants to drill down into the exact position of a specific keyword, or look at how many 404 errors were fixed, they can click the link. The data is transparent and available, but it does not hijack the narrative.
The “So What?” Test.
For every single metric you are tempted to include in the narrative section of the report, ask yourself: So what?
If you say, “Organic impressions are up 45 percent.” So what?
If your answer is, “That means our top-of-funnel content is gaining visibility, which sets the foundation for retargeting campaigns next quarter,” then keep it. Write that explanation down. That is insight.
If your answer is, “I don’t know, but the graph goes up and looks good,” delete it. Clients eventually realise when metrics are being used as filler, and it destroys trust.
Write the report the way you would explain it in a room. Plain language, no jargon, no passive voice. If you would not say “we observed a diminution in organic discovery sessions attributable to enhanced AI Overview prevalence” in a face to face meeting, do not write it in a report.
Say: “Informational traffic fell this month because Google’s AI Overviews are now answering those queries directly. Our rankings are intact. The click opportunity on simple queries has structurally shrunk. Here is what we are targeting instead.”
That explanation is honest, specific, and demonstrates that you understand the environment rather than hiding behind technical language. Clients who understand why something happened trust you. Clients who get jargon when something declines cancel their retainer.
Deliver on a consistent schedule.
Same day of the month, every month, same format. Consistency builds trust through rhythm.
A report that arrives on time in a familiar format tells the client that someone is watching their performance with consistent attention. A report that arrives at random intervals in a slightly different format every month creates the impression that nobody is truly in charge of the account.
→ Full deep-dive in SEO Reporting for Clients
10. Setting Up an SEO Dashboard
A well built SEO dashboard eliminates an entire category of recurring work.
Automated reporting pulls data, builds visualisations, and updates every time the client or stakeholder logs in. Manual spreadsheet exports stop being anyone’s job.
You stop spending three hours each month building a report you already built last month.
That is the promise of Looker Studio done correctly. Here is how to actually build it correctly.
The data sources to connect.
A functional SEO dashboard requires three connections minimum.
Google Search Console via native Looker Studio connector. This provides impressions, clicks, CTR, average position, query data, and page level performance directly from Google.
The connector is free and maintained by Google. Authentication takes five minutes.
Google Analytics 4 via native Looker Studio connector. This provides session data, engagement metrics, conversion events, revenue attribution, user behaviour, and landing page performance.
Also free, also native.
Rank tracking data via API connector from your tool of choice.
Semrush, Ahrefs, SE Ranking, and Authority Labs all offer Looker Studio connectors.
This is where your keyword cohort position trends come from. GSC gives you average positions, which are broad.
A dedicated rank tracking integration gives you tracked position history for your specific target keyword clusters.
Optional but valuable additions: Google Business Profile for local SEO clients, PageSpeed Insights API for Core Web Vitals trend tracking, and a CRM data connection via Google Sheets for revenue attribution if the client’s CRM does not have a direct integration.
The layout: leading indicators feeding lagging indicators.
The dashboard’s architecture should mirror the SEO performance pipeline.
Leading indicators are the metrics that predict future performance. Keyword positions, impressions, crawl coverage, technical health scores.
These change before traffic changes. A position improvement today predicts a traffic increase next month. Track these as forward looking signals.
Lagging indicators are the metrics that confirm past performance. Organic sessions, conversion completions, revenue attributed to organic.
These confirm that the work produced outcomes. Track these as proof of impact.
A dashboard that shows only leading indicators looks like activity without results. A dashboard that shows only lagging indicators gives you no early warning when something starts deteriorating. Both layers are necessary and should be visually connected: keyword cluster position trends feeding into the traffic section, traffic section feeding into the conversion section, conversion section feeding into the revenue summary.
The comparisons that contextualise everything.
Every metric on the dashboard needs a comparative reference point or it is just a number with no interpretive value.
Month over month comparison tells you recent trajectory. Essential for clients in businesses with relatively stable seasonality.
Year over year comparison accounts for seasonality. An e commerce store seeing a traffic dip in January is not experiencing an SEO problem.
It is experiencing January. Year over year comparison makes this immediately obvious and prevents unnecessary panic.
Campaign start to date comparison shows cumulative progress. Particularly useful for new engagements where the first six months are investment rather than returns.
A dashboard showing that non branded traffic is up 340 percent since the campaign started, even if this month’s movement was modest, tells the correct long term story.
The rules that prevent dashboard bloat.
Every chart and metric on a dashboard must earn its presence by answering a specific question that a stakeholder actually asks.
Dashboard bloat filling every available space with metrics because the tools make it easy produces the same outcome as a bloated PDF report: stakeholders who stop looking at it because finding the signal requires too much work.
A focused dashboard for a standard SEO engagement needs a maximum of ten to twelve metrics: non branded clicks and impressions from GSC, average position by keyword cluster, organic sessions from GA4, engagement rate on organic landing pages, conversion completions and revenue from organic, Core Web Vitals pass/fail summary, and a technical health indicator. Everything else is available for ad hoc investigation when needed. It does not need to live on the primary dashboard.
If your dashboard requires a manual spreadsheet export to function, it is broken.
If it requires someone to log in and update data before sending it to the client, it is broken.
Automation is the point. Build it once. Let it run.
Full deep dive in Setting Up an SEO Dashboard
11. Log File Analysis
Google Search Console tells you what Google wants you to know. Your server logs tell you what Google is actually doing. That distinction is not rhetorical.
GSC data is sampled, rounded, and presented through a reporting interface that shows you a filtered version of reality.
Server logs are unfiltered ground truth. Every HTTP request your server received, recorded exactly as it happened: the timestamp, the requesting IP address, the user agent string, the URL requested, the HTTP status code returned, and the number of bytes served.
When Googlebot visits your site, it generates a log entry on your server.
When you analyse those entries systematically, you can see exactly which URLs Googlebot crawled, when it crawled them, how often it comes back, what status codes it received, and what it never visited at all.
No inference. No sampling. The actual crawl record.
Hover or tap to reveal the hidden crawl budget waste
What log files reveal that GSC never will.
The most valuable insight log file analysis consistently surfaces is crawl budget waste.
Every domain receives a finite crawl budget the number of pages Googlebot will crawl in a given period.
On sites with architectural problems, Googlebot spends the majority of that budget crawling URLs that have no SEO value: faceted navigation parameter combinations, internal search result pages that were not properly blocked, session ID URLs generated by legacy platform configurations, redirect chains that terminate in low-value pages.
While the crawl budget is being consumed by these URLs, the new product pages you published last month are being discovered infrequently or not at all.
Your updated content is being re-evaluated slowly. The crawl inefficiency has a direct impact on how quickly Google picks up positive changes you make to the site.
Log file analysis makes this waste visible. You can see the specific URL patterns consuming disproportionate crawl budget, the frequency with which Googlebot revisits low-value pages relative to high-value ones, and the pages that have never been crawled despite being present in the sitemap.
What to look for in the logs.
Load your log files into Screaming Frog Log File Analyser or JetOctopus.
Filter specifically for Googlebot’s user agent string: Googlebot/2.1 .
The patterns worth investigating:
- High crawl frequency on low-value URL patterns. If faceted navigation URLs like /category?colour=red&size=large&sort=price are appearing in the logs dozens of times per day while new product pages appear once per week, your robots.txt configuration is not blocking parameter URLs correctly.
- Status code distribution. What percentage of Googlebot’s requests are returning 200, 301, 404, and 500 responses? A high proportion of 301s means Googlebot is following redirects rather than crawling canonical URLs directly your internal link architecture is pointing to outdated URLs.
- A meaningful proportion of 404s means Googlebot is following internal or external links to dead pages.
- A 500 response at any frequency means server errors are occurring during active crawl sessions.
Segment log entries by URL pattern and calculate how often Googlebot visits each template type. Homepage and high-authority category pages should be crawled frequently. New content should be discovered and re-crawled at a reasonable rate. Pages that appear in the logs at extremely low frequency despite being in the sitemap are being deprioritised by the crawler investigate why.
Pages in the sitemap that never appear in the logs.
Cross-reference your sitemap URL list against logged Googlebot requests.
Any sitemap URL with zero log entries in a 30-day period is effectively invisible to the crawler.
The causes are usually orphan pages with no internal links, pages blocked by JavaScript rendering issues, or pages on sections of the site that Googlebot enters through a different path and never revisits.
The size requirement before log file analysis is worth doing.
Log file analysis delivers disproportionate value on sites with more than ten thousand indexable URLs where crawl budget management is a genuine constraint.
On a twenty-page brochure site, Googlebot crawls the entire site in minutes and crawl budget is irrelevant.
On a fifty-thousand product e-commerce catalog, crawl budget is a real operational constraint and log file analysis is a quarterly necessity.
For smaller sites, log file analysis is still worth running once as a baseline diagnostic during a comprehensive audit.
You will occasionally find surprises a session ID parameter that was never blocked, a legacy URL pattern from a three-year-old migration still generating crawl requests that are invisible in GSC but visible the moment you look at the logs.
→ Full deep-dive in Log File Analysis
12. How to Conduct an SEO Audit Using Data
An SEO audit is not running Screaming Frog, exporting a list of every error it found, and handing the list to a developer.
That is a technical crawl report. A crawl report tells you what exists. An audit tells you what matters, why it matters, and what to fix first.
The difference is data triangulation.
Any individual data source has blind spots. Screaming Frog crawls what it can reach from internal links but does not know what Google has actually indexed. GSC knows what Google has indexed but cannot tell you whether those pages have internal links pointing to them. GA4 knows what users are doing on the pages they visit but knows nothing about the pages they never reach.
Log files know what Googlebot crawled but cannot tell you the content quality of those pages.
The audit is the process of overlaying all four data sources simultaneously and finding the intersections where multiple signals agree that something is wrong.
Those intersections are your high-confidence action items.
The four-layer overlay.
Layer one: Screaming Frog crawl. Crawl with JavaScript rendering enabled. Export everything: all URLs discovered, their status codes, their canonical tags, their meta robots tags, their H1s, their title tags, their meta descriptions, their inlink count, their word count, their response time.
Layer two: GSC indexation report. Export the complete indexation status data from GSC Coverage report. Every URL and its status: indexed, excluded, errored.
Layer three: GA4 organic landing page data. Export organic sessions by landing page for the last 90 days. Every URL that received organic traffic and its session count, engagement rate, and conversion completions.
Layer four: Log file data. Export Googlebot crawl frequency by URL for the last 30 days.
The intersections that reveal real problems.
Join these four datasets in a spreadsheet or BigQuery by URL. The intersections that matter:
Screaming Frog says the page is fine. GSC says “Crawled currently not indexed.” GA4 shows zero organic traffic. Log files show Googlebot visited once, three weeks ago. This is a content quality issue. The page is technically accessible, not blocked, not broken but Google looked at it and decided it was not worth indexing. This is not a technical fix. It is a content review. Is the page thin? Is it near-identical to another stronger page? Does it cover a topic your domain has no topical authority on?
Screaming Frog shows the page has zero inlinks. GSC shows it is indexed. GA4 shows it has organic traffic from a backlink source. This is an orphan page. It is receiving external traffic but has no internal link support. Any authority passing through that backlink has nowhere to flow internally. Add internal links from topically relevant pages immediately.
GSC shows strong impressions and a historically good ranking position. GA4 shows significant organic traffic on that page three months ago but near-zero now. Log files show Googlebot is still crawling it regularly. A page that was ranking, was receiving traffic, and is still being crawled but no longer delivering traffic has likely been displaced by a SERP feature. Check the query directly. If an AI Overview or featured snippet now occupies the top of the results, the impression data will still be high but the CTR will have collapsed. This is not a technical fix. It is a GEO optimisation target.
Screaming Frog shows a page with a 200 status but a meta robots tag of noindex. GSC shows it as excluded. GA4 shows it has no traffic. Log files show Googlebot visits it regularly. A noindex page that Googlebot keeps crawling is wasting crawl budget. Either the noindex is intentional and you should add a Disallow rule in robots.txt to stop Googlebot wasting budget on it, or the noindex was applied accidentally and a valuable page has been excluded from the index without anyone noticing. Both outcomes require immediate action.
Prioritisation: the audit delivers a ranked action list, not an exhaustive error inventory.
Every audit produces more fixable issues than any development team can address in a sprint. The audit’s job is not to list every issue. It is to rank issues by the intersection of impact and effort.
High impact, low effort fixes go first. A noindex tag accidentally applied to a category page that used to rank and drive conversions is a five-minute fix with immediate revenue recovery potential. It goes to the top of the sprint.
High impact, high effort fixes get scoped and scheduled. A full URL structure migration to remove a legacy parameter architecture is high impact but weeks of development work. It goes into a project plan with a timeline.
Low impact fixes, regardless of effort, get deprioritised indefinitely. Fixing broken images on pages with zero traffic, adding meta descriptions to pages that generate no impressions, correcting minor structured data warnings on pages outside the primary conversion funnel these are noise. They appear in automated crawl reports. They do not belong in an audit action list that a business is expected to resource.
The audit’s final deliverable is not a list of problems. It is a prioritised sprint plan with business impact estimates attached to each action item, written in language that a non-technical stakeholder can understand and a developer can immediately act on.
Full deep dive in How to Conduct an SEO Audit Using Data
TL;DR: The Analytics Survival Protocol
Stop drowning in dashboards that look impressive and tell you nothing. Here is the complete reality check.
Traffic is a vanity metric. Revenue is the only reality.
If your reporting stops at sessions and impressions without connecting to leads, bookings, or revenue, you are producing performance theatre. Define your Money Actions before touching any analytics platform. Measure those and only those as primary KPIs.
GSC clicks and GA4 sessions will never match.
Stop trying to reconcile them. GSC measures the click on Google’s side. GA4 measures the session on your side. Privacy browsers and cookie blockers create a growing gap between them. Trust GSC for visibility metrics. Trust GA4 for behaviour metrics. Use both for their respective purposes.
Separate branded from non branded traffic before reporting anything.
Branded traffic growth means your marketing is working. Non branded traffic growth means your SEO is working. Blending them produces a number that flatters both and accurately measures neither.
The ROI formula is simple. The inputs are where practitioners fail.
((Revenue from SEO – Cost of SEO) / Cost of SEO) × 100 .
Revenue requires proper conversion tracking with monetary values. Cost includes everything: retainer, content, tools, internal time. Miss either input and the number is wrong.
Diagnose traffic drops in sequence, not simultaneously.
Check tracking integrity first. Then check for manual actions. Then cross reference algorithm update dates. Then segment by page versus query. Then evaluate AI Overview absorption. Do not skip to algorithm speculation before confirming the data is real.
Log files are the ground truth that GSC cannot give you.
GSC is sampled, filtered, and presented. Server logs are unfiltered reality. If crawl budget is a constraint on your site, log file analysis is how you find out where it is being wasted and fix it with precision rather than guesswork.
Report to clients on business outcomes, not technical operations.
Executive summary first. Non branded traffic growth. Organic conversions and revenue. Keyword cluster movement. Technical fix status. Nothing else belongs in a client report unless the client specifically requested it.
Build the dashboard once. Let it run.
Looker Studio pulling GSC, GA4, and rank tracking data via API connectors. Leading indicators feeding into lagging indicators. Month over month and year over year comparisons built in. A dashboard that requires manual exports is not a dashboard. It is a recurring manual task wearing a dashboard costume.
Audit by data triangulation, not by error count.
A 400 item crawl error list is not an audit. An audit is the intersection of crawl data, indexation data, traffic data, and log data finding where multiple signals agree that something is wrong, then ranking those findings by revenue impact, and producing a sprint plan that a developer can act on without a two hour briefing call.
AI is restructuring the top of the funnel permanently.
Informational query traffic is declining structurally as AI Overviews absorb clicks. If your traffic dropped and your impressions held, AI Overviews are the explanation. The response is a content strategy shift and Citation Rate tracking, not a technical SEO investigation.
Data without action is just trivia. Find the bottlenecks. Prove the ROI. Fix the site. Everything else is noise.